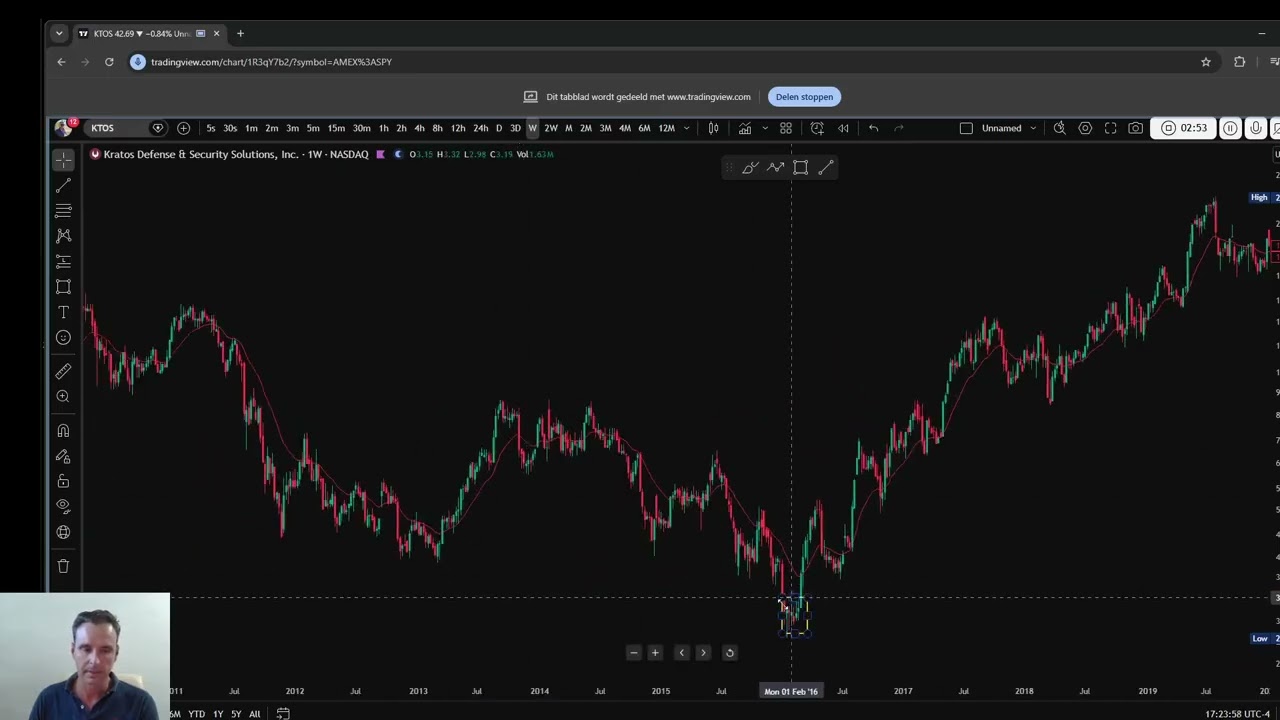
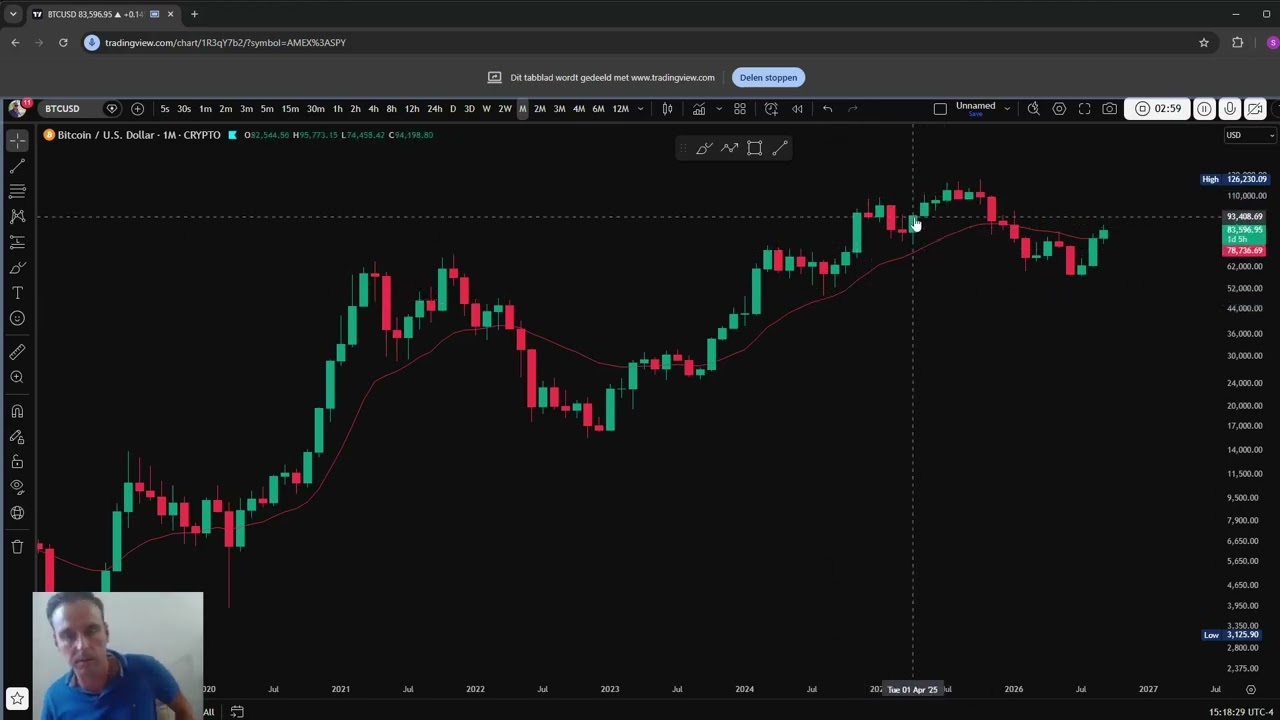
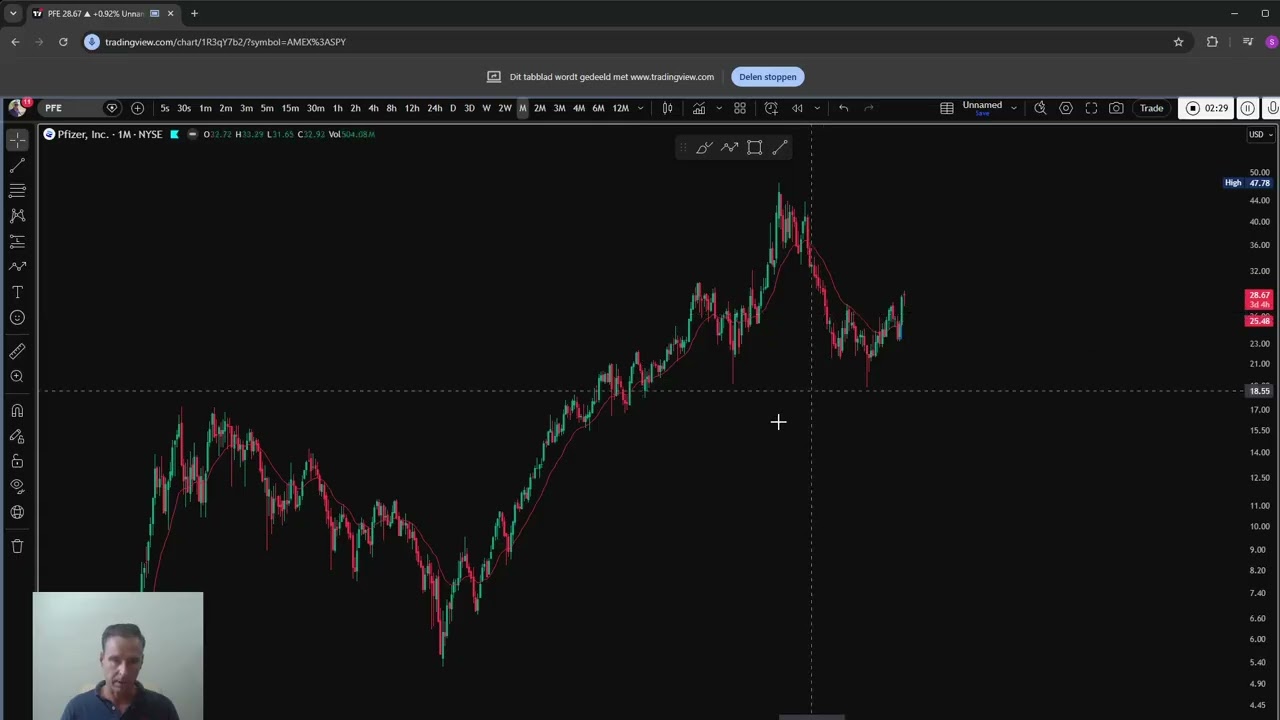
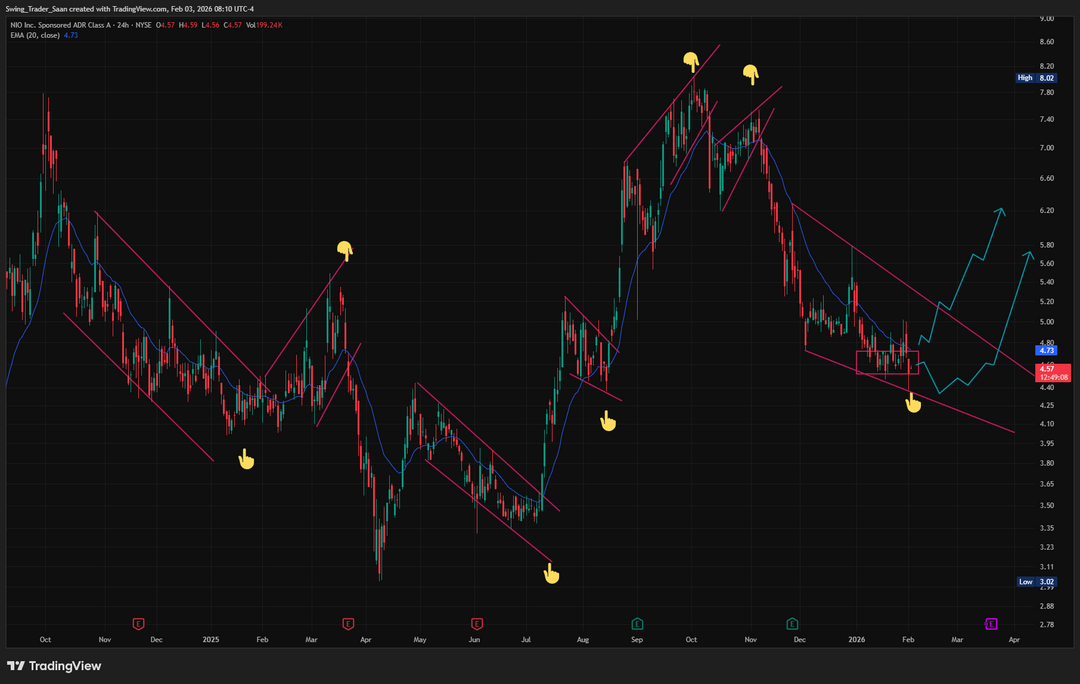
 Open full size ↗
While it may not look like it at first glance, bear channels and bear wedges often function the same way as bull flags. Statistically, they resolve higher roughly 70% of the time — and vice versa in downtrends.
Do the work yourself
As always, I encourage you to study this yourself. Doing that work builds real confidence. Like always in trading — marking these patterns in hindsight is far easier than identifying and trading them in real time. With enough practice, and most importantly solid risk management, these structures will become very profitable over time when executed correctly.
Two ways to trade the same structure
There is no single right answer here. Two traders can look at the identical wedge and take opposite approaches to it, and both can be right over a long enough sample. What separates them is where they choose to take their pain.
Scaling in — the higher-probability approach
I know traders who prefer a higher-probability approach and choose to scale into positions at these levels. They start small and add as price moves lower. Their win rate might be closer to 60%, but in most cases the average profit per trade is smaller.
This style also comes with a real danger. Roughly 30% of the time the pattern fails, and by then the trader may already be in three times their initial size. Because the position has grown larger than normal, it becomes very easy to make emotional decisions. That is exactly when you need to be razor-sharp. When these patterns fail, they often fail fast, as traders and algorithms exit simultaneously. Precision matters — you need to act like a sniper, not hesitate.
I know many traders who operate this way, and it is a perfectly valid approach.
Tight stops — the approach I use
Personally, I prefer a different style. I trade with tight stops, so that if the move starts immediately, I am already in with a larger position. The downside is that my win rate is lower — often around 40% — because I may need a few attempts before catching the winner.
The upside is that the reward is usually three times the risk or more. With that kind of expectancy, over a large sample size — say 200 trades — the outcome is almost always a meaningful profit, provided execution and discipline are consistent.
Scale in
- Win rate — around 60%
- Average win — smaller
- Size at risk — grows as price moves against you
- Failure mode — oversized when the 30% hits
- Demands — ruthless exits under pressure
Tight stops
- Win rate — around 40%
- Average win — 3R or better
- Size at risk — fixed and known up front
- Failure mode — several small losses in a row
- Demands — patience to keep re-entering
Neither one is better
Both styles have clear pros and cons. Over the long run, their results tend to converge. No approach is inherently superior. It ultimately comes down to personal preference, psychology, and execution.
What matters most isn’t the pattern itself — it’s how you manage risk and stay consistent.
See the framework applied to live positions
The theory is free and stays free. What's inside Patreon is the daily application of it — real plans with levels, position updates while trades are on, and every exit explained.
Join on PatreonFor educational purposes only — not financial advice. Every probability quoted here is an observation from my own study and record-keeping, not a guarantee. Do your own work.