 Open full size ↗
A range on a chart is not a drawing. It is a cluster of resting orders, made visible.
What the order book taught me
Eight years ago, when I was trading at a trading firm, many traders there didn’t use charts at all. They traded purely off Level 2 order book data. They knew exactly where large clusters of buy and sell orders were sitting, and when those levels broke, they entered in the direction of the break.
For months, I did the same.
But I was already a chart trader before joining the firm, so I still checked charts on my phone. What I quickly realised was this: those “order book breakouts” were simply clean chart breakouts. The same concept, read through a different window.
You don’t need the order book — because price structure already reflects the same supply and demand.
Where they taught me to put stops
One lesson from that desk has stayed with me, and it had nothing to do with entries. It was about stop placement:
- Identify a large order cluster.
- If it fails to hold, exit immediately.
- Better still — exit within the final 10% of liquidity, before that cluster gets cleared.
Say there is a $5 million sell cluster near the top of a range. You use the final 10% of that supply to cover your short. You are out while the liquidity is still there to get out into, rather than after it has gone.
That keeps risk tight, and it is the difference between a small loss and a bad one.
Major ranges and internal ranges
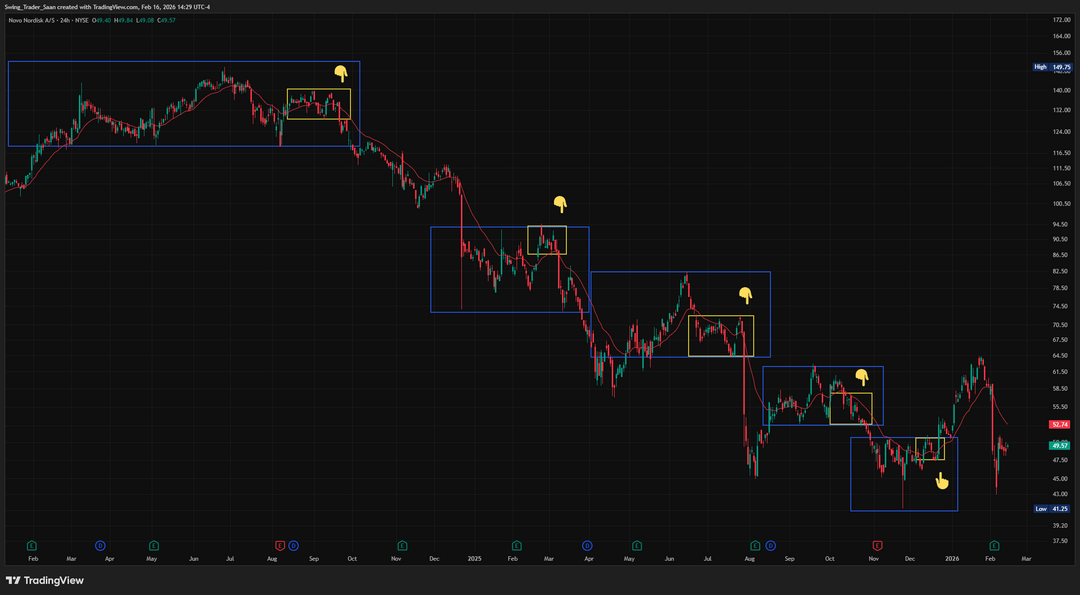
Look at the chart above. There are two kinds of box on it, and the distinction is the whole module:
Major ranges
- The broad area price is balancing in
- Tops and bottoms are large order clusters
- Obvious to everyone looking at the chart
- Stops placed outside them are wide
Internal ranges
- A tighter range built inside the major one
- Its own tops and bottoms are order clusters too
- Where pressure actually builds
- Stops placed against them are tight
Most traders see the blue box and trade it. The edge is in the yellow one.
Why the internal range is worth more
1. Pressure builds inside ranges
The clearer and tighter the internal range, the more pressure builds behind it. The more pressure, the higher the probability of an explosive move when it resolves. That gives the trade an early momentum push — which means your risk comes off the table quickly rather than slowly.
2. Precision stop placement
Use the opposite side of the internal range as your stop. That one decision changes the arithmetic of the trade completely. Instead of a wide stop outside the entire major range, you are trading the internal structure with tight invalidation.
Same idea, same direction, same target — but a fraction of the risk per share. And since position size is calculated from the stop, a tighter stop means you can hold the same risk with a larger position, or the same position with far less risk.
If this sounds familiar, it should: it is the same mechanism as tension boxes, applied inside a range rather than inside a trend.
What actually determines profit
At the end of the month, only two things matter:
Your profitability is simply the interaction between those two variables. Nothing else. Entries, indicators, conviction, how good the story sounds — none of it survives contact with a month of results unless those two numbers are in your favour.
See the framework applied to live positions
The theory is free and stays free. What's inside Patreon is the daily application of it — real plans with levels, position updates while trades are on, and every exit explained.
Join on PatreonFor educational purposes only — not financial advice. Every probability quoted here is an observation from my own study and record-keeping, not a guarantee. Do your own work.